虚空的分享,文件在墙外,稍等 (更新中, 没那么快)
粗略看了一下,是R最重要包之一ggplot2
https://www.datanovia.com/en/blog/ggplot-examples-best-reference/
目录
Scatter plot √
Distribution √
Density plot √
Histogram 以下等待搬运=-=
QQ Plot
Empirical cumulative distribution (ECDF)
Density ridgeline plots
Bar charts and alternatives
Line plot
Error bars
Box plots and alternatives
Time series data visualization
scatter plot matrix
Correlation analysis
Cluster analysis
Balloon plot
稍等
0. 配置
library(tidyverse)
library(ggpubr)
theme_set(
  theme_bw() +
  theme(legend.position = "top")
  )
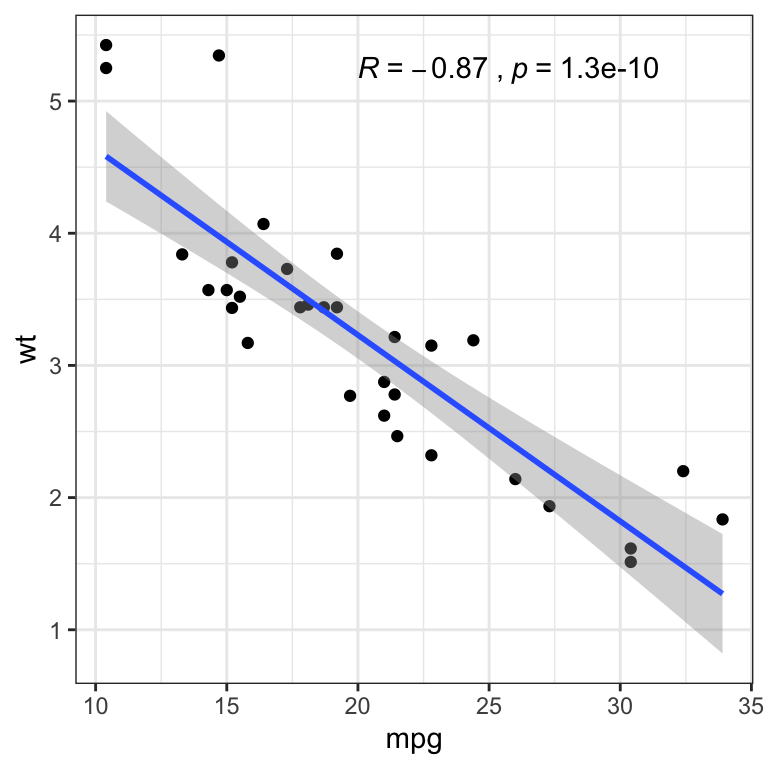
1. 散点图Scatter Plot
library("ggpubr")
p <- ggplot(mtcars, aes(mpg, wt)) +
  geom_point() +
  geom_smooth(method = lm) +
  stat_cor(method = "pearson", label.x = 20)
p

2. Contextual zoom. facet_zoom
library(ggforce)
ggplot(iris, aes(Petal.Length, Petal.Width, colour = Species)) +
    geom_point() +
    facet_zoom(x = Species == "versicolor")

3. 画圈 (聚类)
# Encircle setosa group
library("ggalt")
circle.df <- iris %>% filter(Species == "setosa")
ggplot(iris, aes(Petal.Length, Petal.Width)) +
    geom_point(aes(colour = Species)) +
  geom_encircle(data = circle.df, linetype = 2)

4. 重叠点散开 (随机,限定范围在width里) Create jittered points to avoid overlap.
# Basic scatter plot
ggplot(mpg, aes(cty, hwy)) +
  geom_point(size = 0.5)

# Jittered points
ggplot(mpg, aes(cty, hwy)) +
  geom_jitter(size = 0.5, width = 0.5)
| 散开 | 原始 |
|---|---|
 |
 |
还有好多。。。
2. 分布 Distribution
Density plot 密度图
# Basic density plot
ggplot(iris, aes(Sepal.Length)) +
  geom_density()

# Add mean line
ggplot(iris, aes(Sepal.Length)) +
  geom_density(fill = "lightgray") +
  geom_vline(aes(xintercept = mean(Sepal.Length)), linetype = 2)
| 基础密度图 | 加了中位线 |
|---|---|
 |
 |

